
17100 Wood Acre Trail
Chagrin Falls, Ohio 44023
Phone/Fax: 440-708-2211
Email: BudingerPA@MSN.com
TECHNICAL SERVICE RESPONSE NO.: UT040
Subject: Analysis of Soils from an Ice Pictogram Formation which was found in Snasa, Norway (December 2003)
Date: May 17, 2005 Requested By: Nancy Talbott
BLT Research
Reported By: P. A. Budinger
Analytical Scientist
Background/Objective:
The background as described by Nancy Talbott follows.
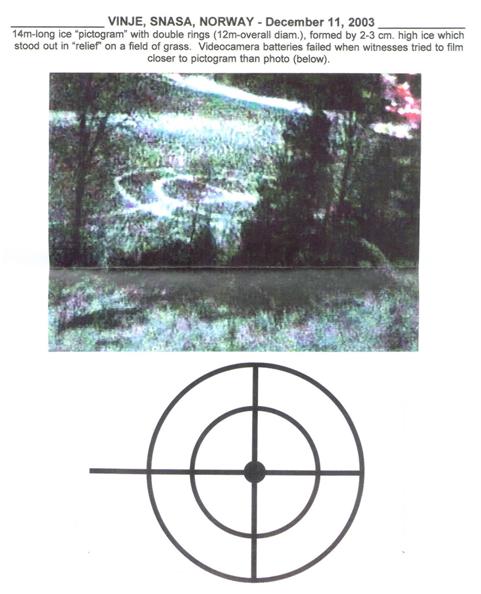
“A most unusual pictogram” was found in Norway in December 2003. It was made up of ice, 2-3 cm high, formed in rings and pathways. A light snow had fallen on top of the ice circle making it clearly visible.
The following spring fieldworkers took 4 soil samples and 4 soil controls in the hopes that you could look at them for any sign of a contaminant in the soils that might account for the ground/snow melting and then re-freezing.
Interviews with locals provided no ready explanation for the marking. The field was simply a grass field/meadow.
That spring of 2004 showed some of the marking in the growing grass where, apparently, the grass was not growing normally. From the photo it looks as if the ring areas may have been mostly dirt in 2004, when sampled. Perhaps some substance has impeded the growth of the grasses?
The field team says that lime and fertilizer had been spread on this field by the farmer one week or so before the soil samples were taken.”
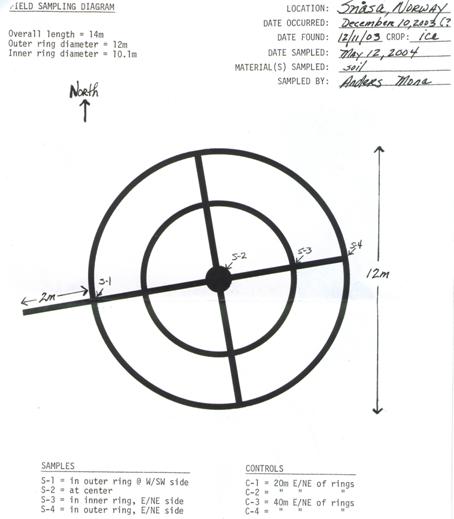
A photograph and diagram of the site follows.
Conclusions:
·No unusual contamination was detected in the pictogram soil. Either no chemical was used to produce the pictogram, or it was depleted and dispersed into the soil long before sampling.
·There are materials detected in both pictogram and control soils. Ammonium nitrate predominates. This is from fertilizer. There are also other natural soil organics, which include a small amount of natural ester and a very trace level of a waxy long chain hydrocarbon.
Procedure:
The samples consist of four soils from the pictogram and four control samples. The Pictogram was noted In December 2003. The soils were sampled four months later on12 May 2004.
Following is a ring diagram of the formation showing the sampling locations.
Infrared spectra were obtained from selected “as received” soils. Additionally, all soils were solvent extracted using progressively polar solvents, i.e. hexane, 1:1 acetone:methanol, and water. This was done quantitatively to determine the amounts of each extract. Infrared spectra were acquired from selected extracts.
Infrared spectra of the control soil and pictogram soil are identical. That is, the pictogram soil shows no extraneous contaminant absorption compared to the control soil. Following are selected spectra of a pictogram soil (S2) and a control soil (C1) for comparison.
Infrared Spectra of the S2 Pictogram Soil and C1 Control Soil
 Analysis of the Solvent Extracts from the Soil
The amounts of extracted material are very low. They are about the same for the pictogram soils and control soils, i.e. within experimental error. This indicates there is no contamination present. The amounts for each extract (hexane, 1:1 acetone:methanol, and water) follow.
�
Amounts of Extracts from the Pictogram Soils and Control Soils
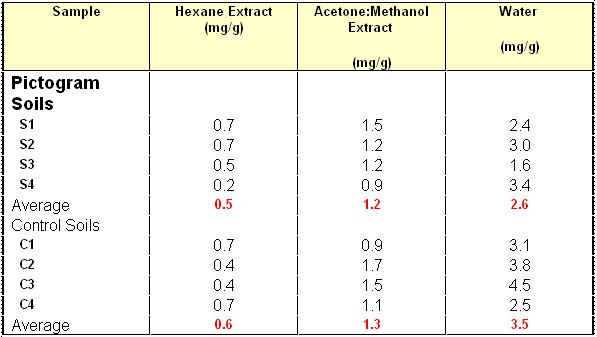
*Excessive soil fines are in this sample, which could not be filtered out. Therefore, the value is higher than it should be. This also skews the average value for the control acetone:methanol extracts to the high side.
Infrared analysis of the extracts from selected soils from the pictogram and controls display similar spectra. The spectra show no additional absorption from contamination in the ring soils when compared those from the controls. The following components were found in the in the extracts.
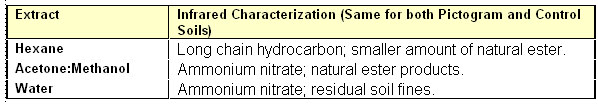
Representative spectra from a pictogram soil and control soil from each extract follow. Pertinent absorption peaks are labeled.
Infrared spectra of Hexane Extracts from a Pictogram Soil (S2) and a Control Soil (C3)
Infrared spectra of Acetone:Methanol Extracts from a Pictogram Soil (S2) and a Control Soil (C4)
Infrared spectra of Water Extracts from a Pictogram Soil (S2) and a Control Soil (C3)
FILE: UT040
_______________